Metrics Module: AI Metrics
Introduction
This page is designed to provide CIOs and leaders with better insights into how effectively AI is being used in project development. Through an interactive dashboard, it is possible to filter and visualize key data related to AI utilization.
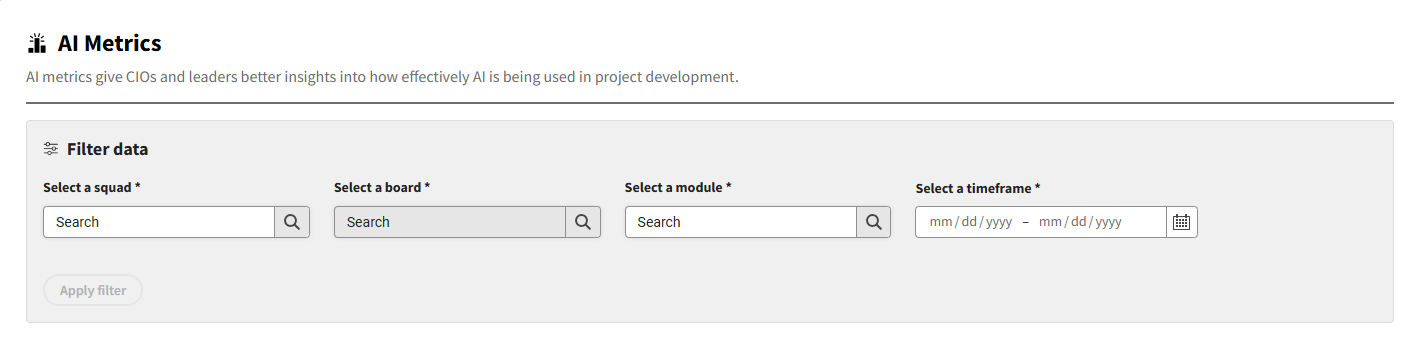
Filter Data
The dashboard provides a filtering section to refine the data displayed. The available filters are:
- Select a squad: Filter the data by a specific squad.
- Select a board: Filter the data by a specific board.
- Select a module: Filter the data by a specific module. The available modules are:
- Requirement
- Code
- Quality Assurance
- Select a timeframe: Filter the data by a specific date range.
Once all filters are selected, the user can click the "Apply filter" button to see the results.
After applying the filters, the relevant metrics will be displayed in the main area of the page.
Requirement Module
This section provides an example of how to use the AI Metrics page to analyze the efficiency of AI in the requirement definition process.
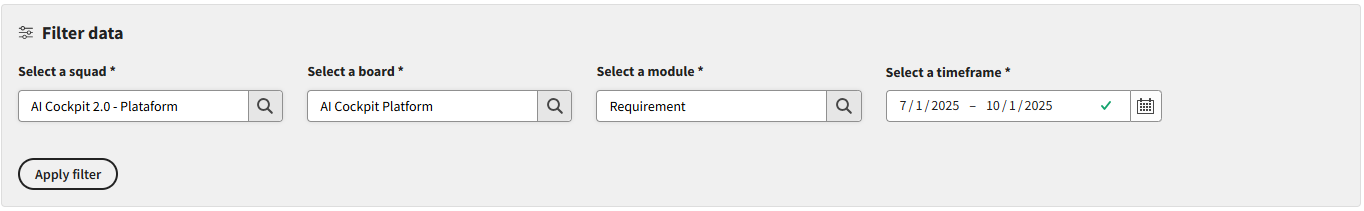
Filtering
The following filters were applied to generate the results:
Results
After applying the filters, the following metrics are displayed:
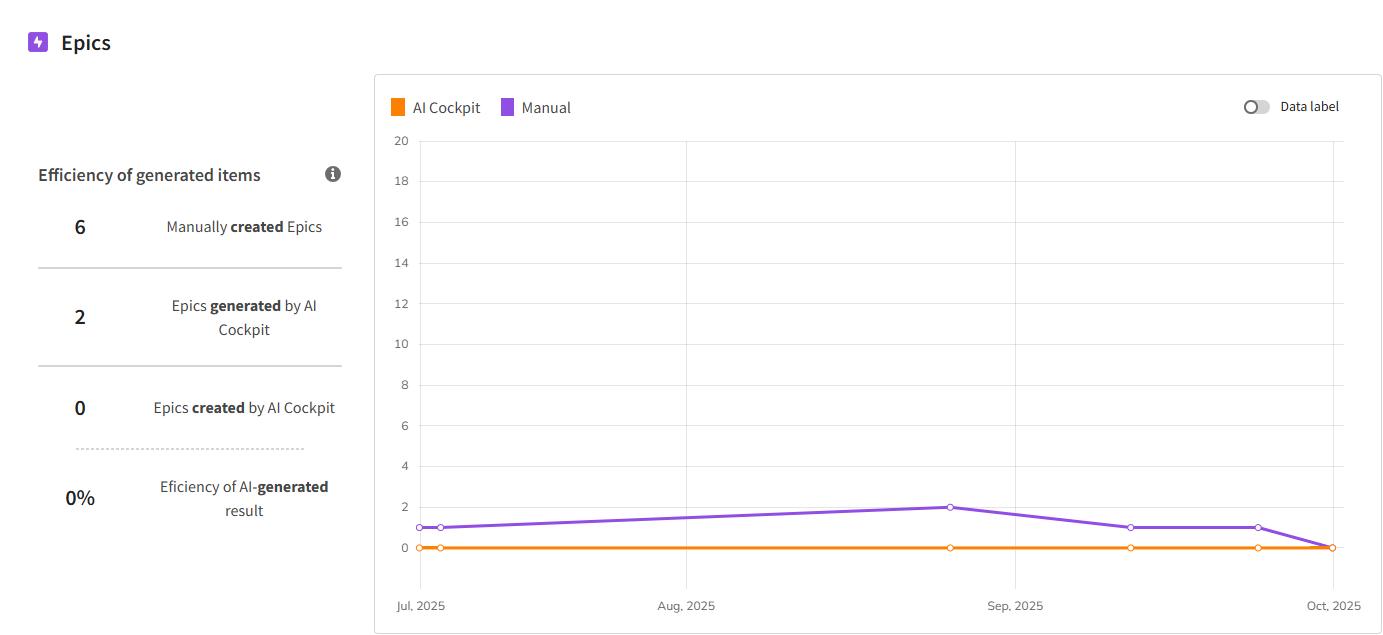
Epics
This section shows the efficiency of AI in generating Epics.
- Manually created Epics: 6
- Epics generated by AI Cockpit: 2
- Epics created by AI Cockpit: 0
- Efficiency of AI-generated result: 0%
The chart shows the number of Epics created manually versus those generated by AI Cockpit over the selected timeframe.
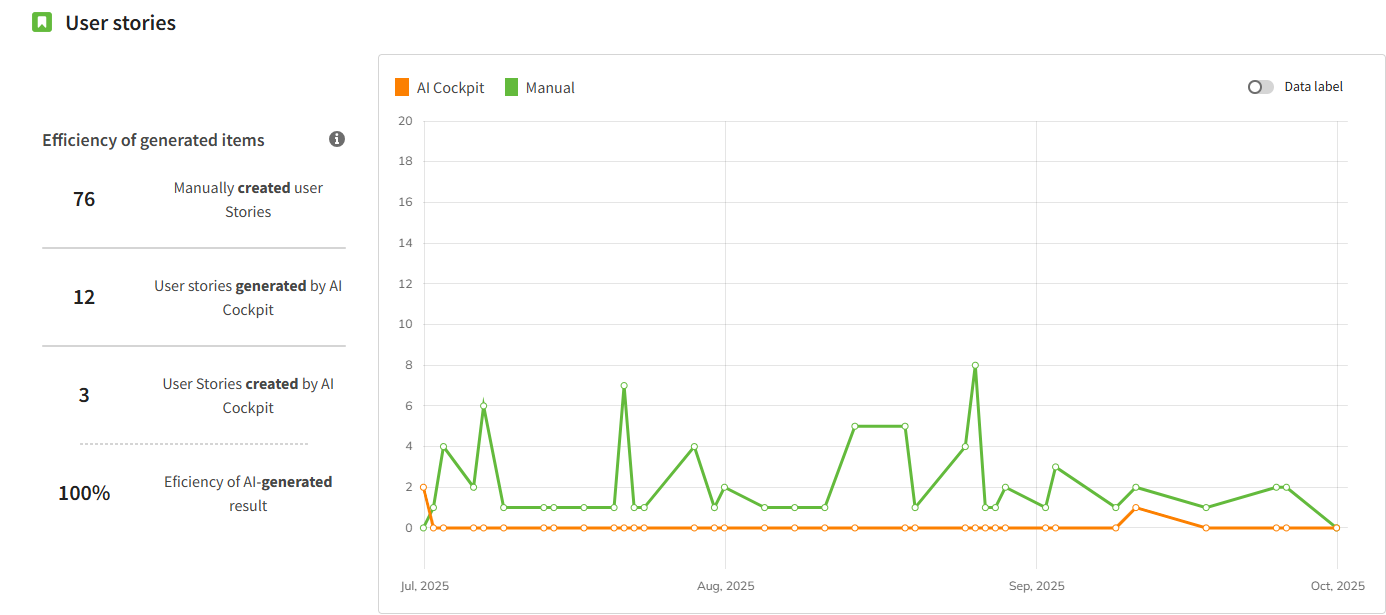
User Stories
This section shows the efficiency of AI in generating User Stories.
- Manually created user Stories: 76
- User stories generated by AI Cockpit: 12
- User Stories created by AI Cockpit: 3
- Efficiency of AI-generated result: 100%
The chart shows the number of User Stories created manually versus those generated by AI Cockpit over the selected timeframe.
Code Module
This section provides an example of how to use the AI Metrics page to analyze the efficiency of AI in the code generation process.
Filtering
The following filters were applied to generate the results below:
- Select a squad: AI Cockpit 2.0 - Platform
- Select a board: AI Cockpit Platform
- Select a module: Code
- Select a timeframe: 7/1/2025 - 10/1/2025
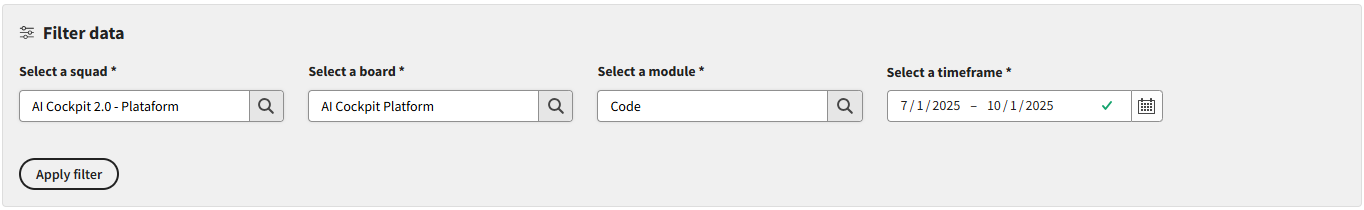
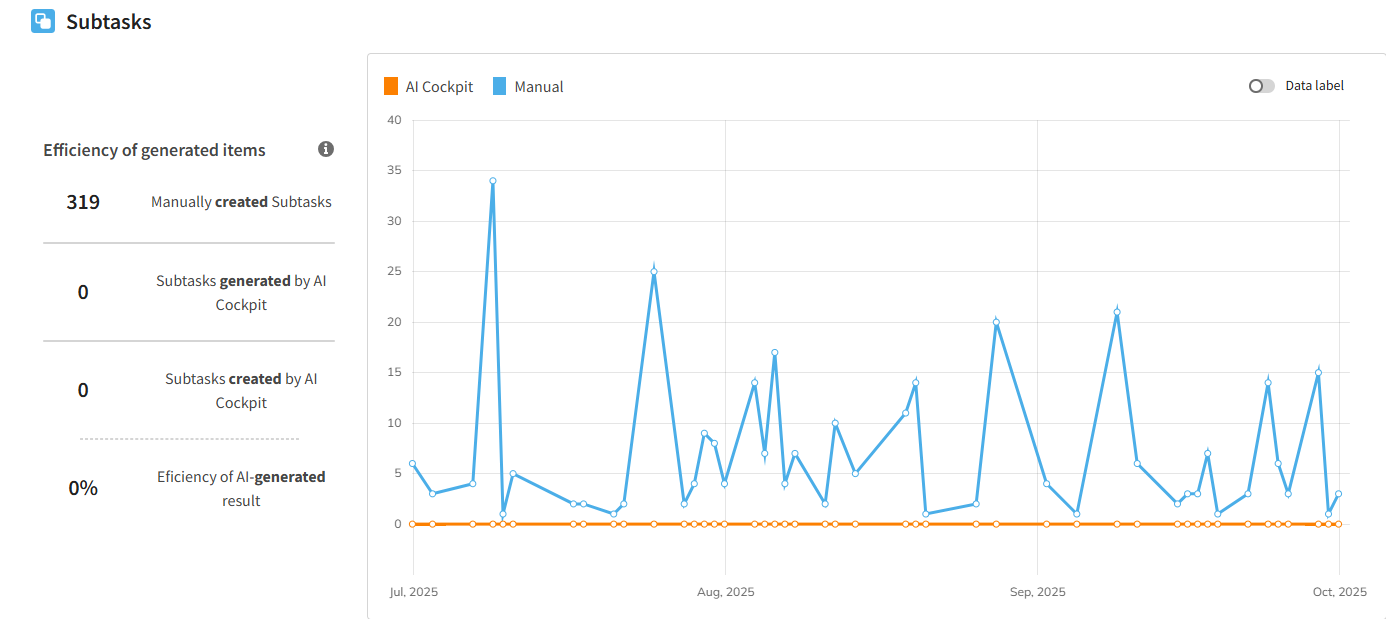
Results
After applying the filters, the following metrics for "Subtasks" are displayed, showing the efficiency of AI in generating subtasks related to code.
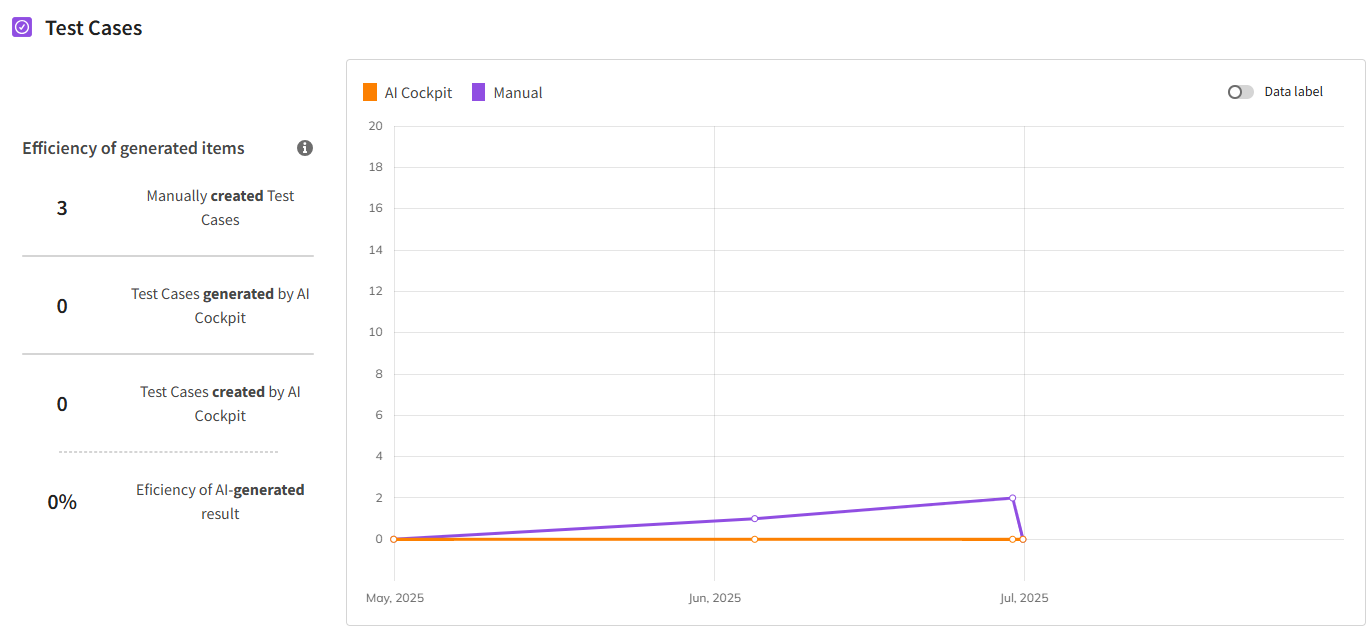
Quality Assurance Module
This section provides an example of how to use the AI Metrics page to analyze the efficiency of AI in the quality assurance process.
Filtering
The following filters were applied to generate the results below:
- Select a squad: AI Cockpit 2.0 - Platform
- Select a board: AI Cockpit Platform
- Select a module: Quality Assurance
- Select a timeframe: 5/1/2025 - 7/31/2025
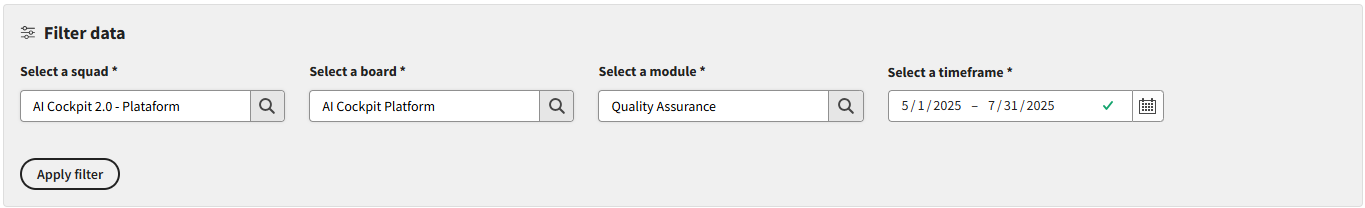
Results
After applying the filters, the following metrics for "Test Cases" are displayed, showing the efficiency of AI in generating test cases.