Cost by Tool
This page describes the By Tool tab — the product-level cost breakdown view in AI/R Watch.
The By Tool tab provides a detailed cost breakdown organized by product, vertical, and usage metrics. It is designed for teams that need to understand which specific tools are being used, by whom, and at what cost — beyond the high-level categories shown in the Executive View.
Product Filter
A Product filter is available in the period selector bar when the By Tool tab is active. Use it to restrict all views to a specific product, or leave it set to All products to see the full picture.
Sub-tabs
The By Tool tab is divided into three sub-tabs: Product, Vertical, and Metrics.
Product
The Product sub-tab shows cost broken down by individual product and user.
Summary Cards
| Card | Description |
|---|---|
| Spend in the Period | Total cost across all products in the selected period |
| Leading Product | Product with the highest accumulated cost |
| Tracked Products | Number of distinct products with recorded cost |
| Monthly Average | Average monthly cost, with the number of allocated users |
Cost by Product Over Time
A time series bar chart shows the monthly cost for the top products. Each series is color-coded by product. Projected months are shown with a lighter fill and a ~ prefix.
Cumulative Cost by Product
A stacked bar chart shows the running total of cost per product across the period. This highlights which products are accumulating the most spend over time.
Period Distribution
A donut chart shows the share of each product in the total cost for the period.
Product Detail Table
The detail table lists all products with cost in the period:
| Column | Description |
|---|---|
| Product | Product name |
| Group | Product group or family |
| Monthly columns | Cost per month; projected months shown with ~ prefix |
| Period Total | Total cost accumulated across the selected period |
| MoM | Month-over-month percentage change |
User Detail Table
Below the product detail, a User Detail table lists individual users and their associated product costs for the period.
- Use the Search field to filter by user name or product name.
- The table shows up to 20 records at a time; scroll to see more.
- Columns: Month, User, Product, Cost (USD).
Vertical
The Vertical sub-tab shows cost broken down by organizational vertical or business unit. It uses the same layout as the Product sub-tab:
- Summary cards (spend, leading vertical, tracked verticals, monthly average)
- Time series bar chart
- Period distribution donut chart
- Detail table with monthly breakdown and MoM
This view is useful for understanding which parts of the organization are driving the highest AI tool costs.
Metrics
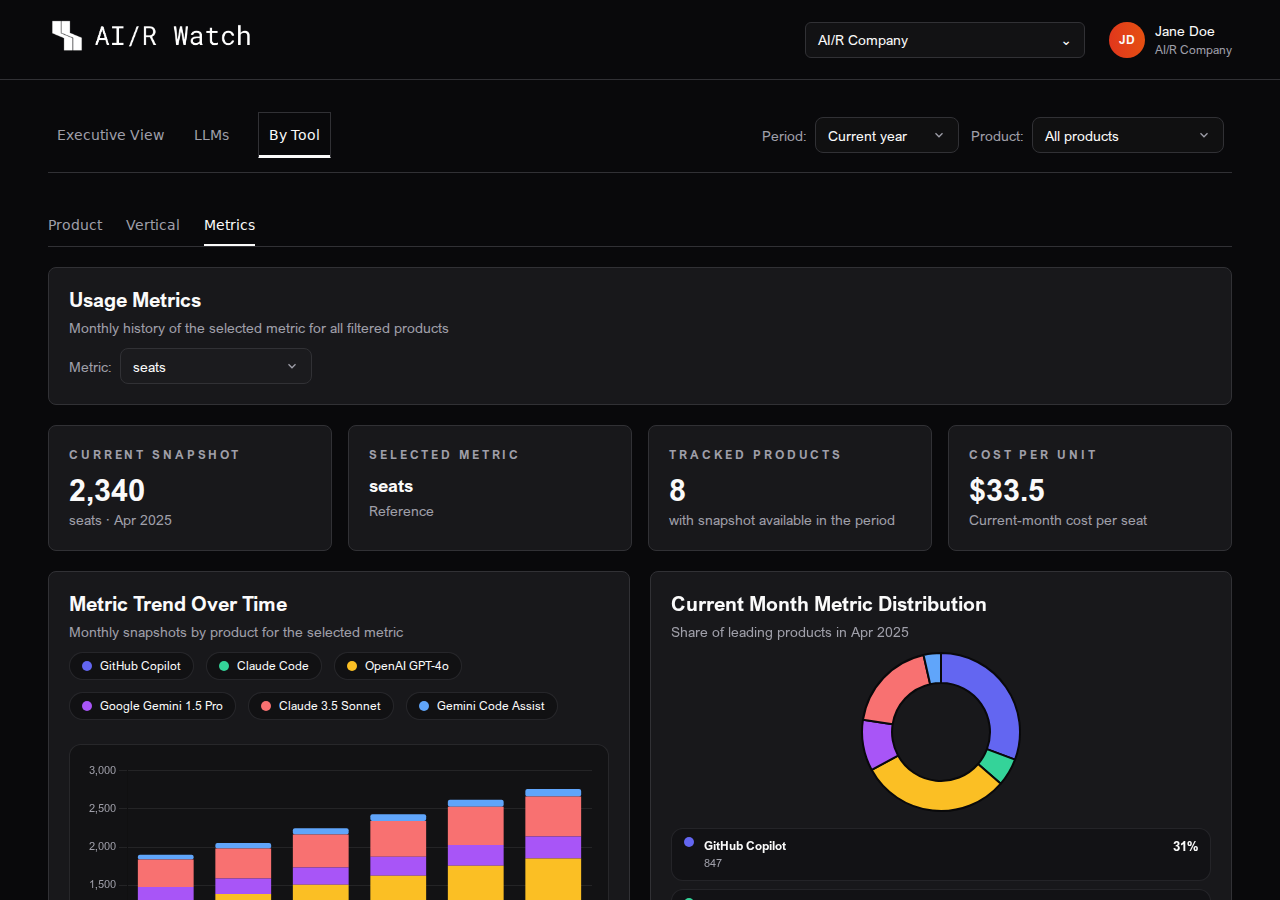
The Metrics sub-tab shows usage metrics (such as seat counts or license quantities) alongside their associated costs. It is designed to help teams understand the relationship between usage volume and financial impact.
Metric Selector
A Metric dropdown at the top of the section lets you choose which metric to display. Available metrics depend on the products configured for your organization (for example: seats, licenses, active users).
Summary Cards
| Card | Description |
|---|---|
| Current Snapshot | Total metric value for the most recent month with data |
| Selected Metric | Name and unit of the currently selected metric |
| Tracked Products | Number of products with snapshot data available |
| Cost per Unit | Current-month cost divided by the current-month metric value |
Metric values are monthly snapshots — they represent a point-in-time count, not a cumulative total. Do not sum them across months to calculate a period total.
Metric Trend Chart
A time series bar chart shows the monthly metric value for the top products. Projected months are shown with a lighter fill.
Current Month Distribution
A donut chart shows the share of each product in the total metric value for the most recent month.
Metric Detail Table
The detail table lists all products with metric data:
| Column | Description |
|---|---|
| Product | Product name |
| Group | Product group or family |
| Monthly columns | Metric value per month; projected months shown with ~ prefix |
| Current Month Cost | Cost associated with the reference-month snapshot |
| Cost per Unit | Current-month cost divided by the current-month metric value |
| MoM | Month-over-month percentage change in the metric value |
Snapshot Interpretation
The Snapshot Interpretation card at the bottom of the Metrics section provides a summary of the current and previous month snapshots alongside the current-month cost. Use this to quickly assess whether usage volume is growing and whether cost is tracking proportionally.
Next Steps
To ask questions about your spend data in natural language, open the AI Cockpit Finance Chat. To return to the consolidated overview, see Executive View.