LLM Usage
This page describes the LLMs tab — the detailed language model API cost view in AI/R Watch.
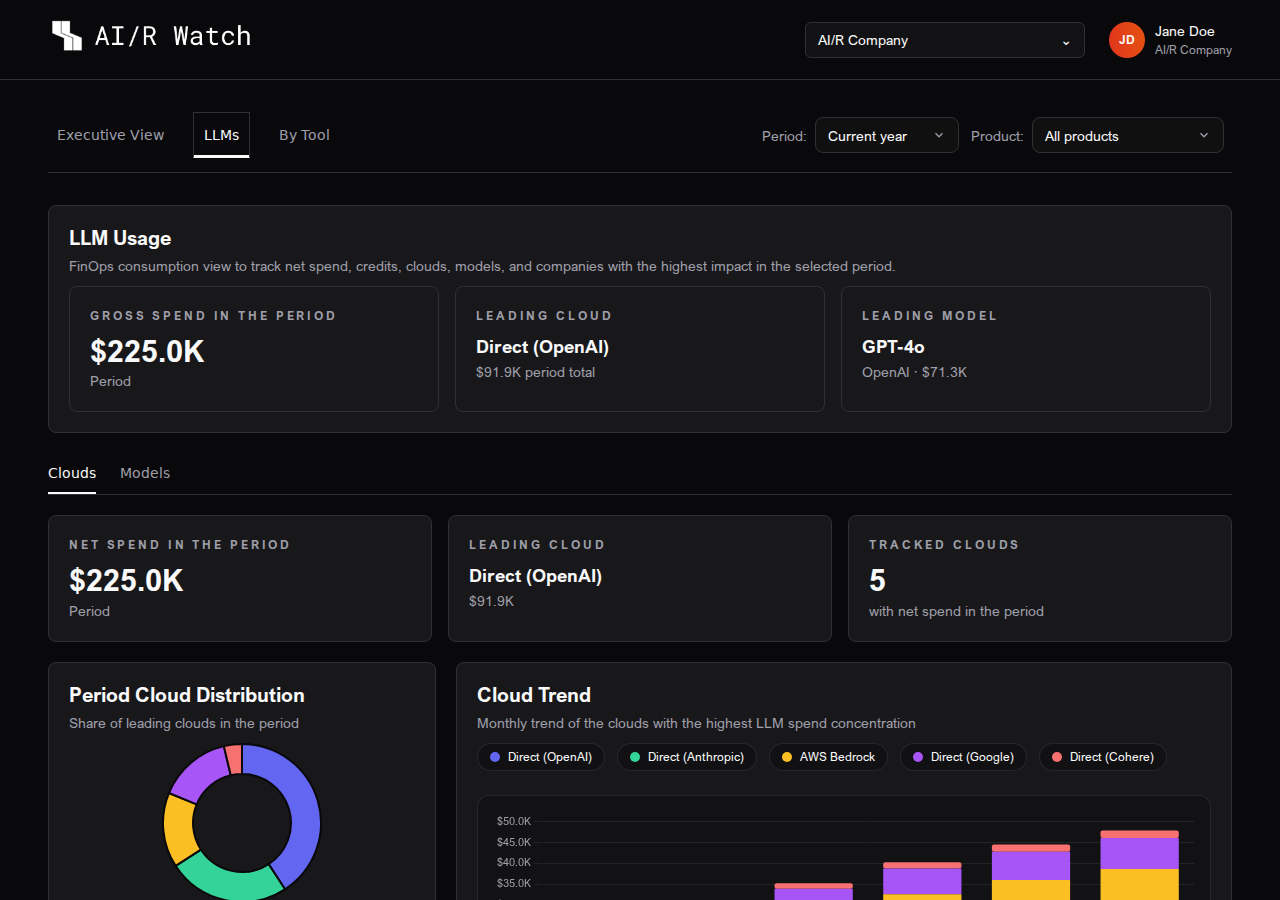
The LLMs tab provides a detailed breakdown of language model API costs. It is designed to help teams understand which cloud providers and models are driving the highest spend, track token consumption over time, and identify month-over-month trends.
Overview Cards
At the top of the LLMs tab, three summary cards provide a quick read of the period:
| Card | Description |
|---|---|
| Gross Spend in the Period | Total LLM API spend before credits, for the selected period |
| Leading Cloud | The cloud provider with the highest net spend |
| Leading Model | The language model with the highest net spend |
Sub-tabs
The LLMs tab is divided into two sub-tabs: Clouds and Models. Use the tab bar below the overview cards to switch between them.
Clouds
The Clouds sub-tab shows spend broken down by cloud provider.
Summary Cards
| Card | Description |
|---|---|
| Net Spend in the Period | Total net spend across all cloud providers |
| Leading Cloud | Cloud provider with the highest net spend |
| Tracked Clouds | Number of distinct cloud providers with recorded spend |
Cloud Trend Chart
A time series bar chart shows the monthly net spend for the top cloud providers over the selected period. Each series is color-coded by provider. Projected months (when the current month is incomplete) are shown with a lighter fill and a ~ prefix on the month label.
Cloud Distribution
A donut chart shows the share of each cloud provider in the total LLM spend for the period. Hovering over a segment displays the provider name and its absolute value.
Cloud Detail Table
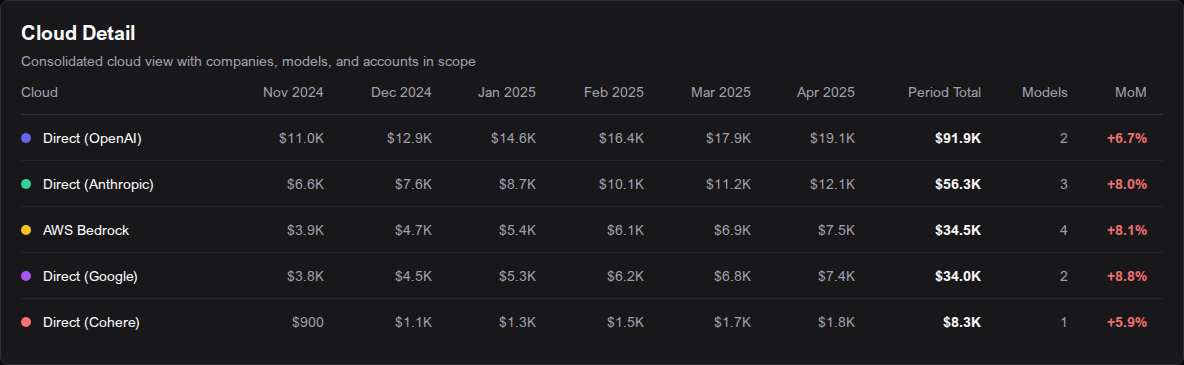
The detail table lists all cloud providers with spend in the period:
| Column | Description |
|---|---|
| Cloud | Cloud provider name |
| Monthly columns | Net spend per month; projected months are shown with ~ prefix |
| Gross Cost (USD) | Total gross spend for the period |
| Models | Maximum number of distinct models used in any single month |
| MoM | Month-over-month percentage change |
Models
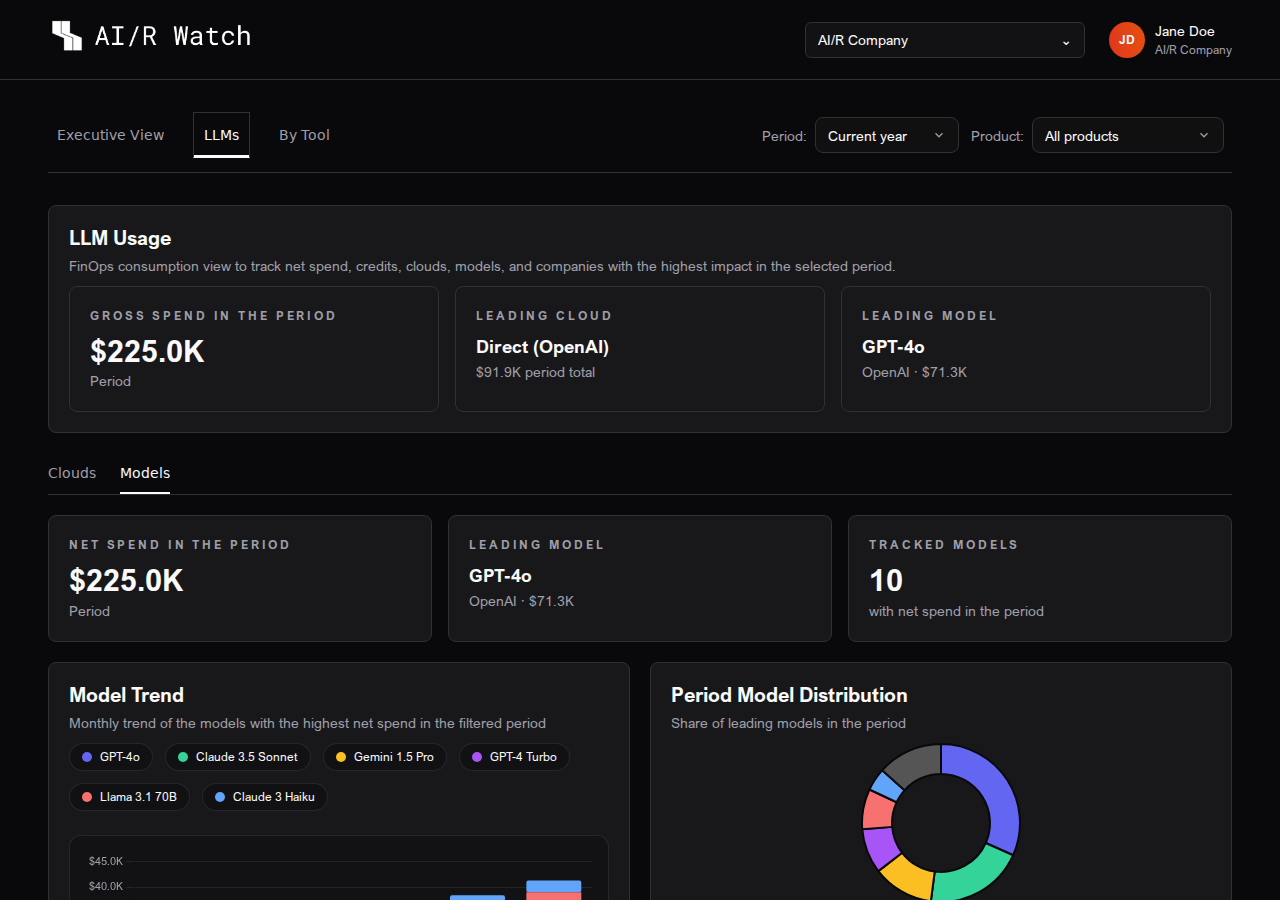
The Models sub-tab shows spend broken down by individual language model.
Summary Cards
| Card | Description |
|---|---|
| Net Spend in the Period | Total net spend across all models |
| Leading Model | Model with the highest net spend |
| Tracked Models | Number of distinct models with recorded spend |
Model Trend Chart
A time series bar chart shows the monthly net spend for the top models. Each series label includes the provider name and the model name. Projected months are shown with a lighter fill.
Model Distribution
A donut chart shows the share of each model in the total LLM spend for the period.
Token Volume
When token data is available, the Models sub-tab also displays a Token Volume section:
Token Summary Cards
| Card | Description |
|---|---|
| Tokens in Period | Total tokens consumed across all models in the period |
| Input Tokens in Latest Month | Input tokens for the most recent month with data |
| Output Tokens in Latest Month | Output tokens for the most recent month with data |
Token Trend Chart
A time series bar chart shows the monthly breakdown of Total, Input, and Output tokens. This helps identify whether input or output token consumption is driving cost growth.
Token volume data is captured from the observability layer. If your organization has not configured token tracking, this section will not appear.
Model Detail Table
The detail table lists all models with spend in the period:
| Column | Description |
|---|---|
| Model | Language model name |
| Provider | Cloud provider or API provider |
| Monthly columns | Net spend per month; projected months shown with ~ prefix |
| Gross Cost (USD) | Total gross spend for the period |
| MoM | Month-over-month percentage change |
Partial Data Notice
If the LLM detail view is not fully accessible for the current organization, a warning banner appears at the top of the tab:
The detailed LLM view may not be accessible with the current data access configuration. Cloud provider charts remain available, but model-level data may appear empty until the appropriate permissions are granted.
Contact your platform administrator if you see this notice and expect to have access to model-level data.
Next Steps
To analyze costs by product, vertical, and usage metrics, go to Cost by Tool. To return to the consolidated overview, see Executive View.